This is the type of picture I've been making for the past three weeks. That rainbow blob thing in the middle is made up of several thousand dots1. Wouldn't it be nice if I could stretch them out to fill the whole box instead of having them all jammed together in the middle?
 |  |
Here's the direction I want to stretch them. The one on the right is a bird's eye view of the same thing. Unfortunately, I can't stretch them out that way. I can only stretch them in one of these ways:
 |  |
 |  |
Obviously, then, I should move the blob until it's pointing in a better direction. To be able to stretch them the way I want, it needs to be pointed like so:

See how easy that was in Photostudio? Unfortunately, it doesn't work like that when it's a bunch of dots on a grid. To do what I want, I need to either move the grid around to match the blob, or move the blob around to match the grid.
 |  |
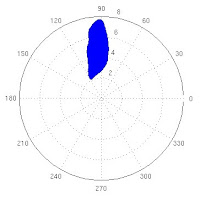
Lots of people made lots of suggestions, all of which had strange side effects, so in the end, I didn't end up using any of them. See, it turns out that although it's hard to rotate a blob of dots when you have them in a box, it's not at all hard when you've got them on a circle2. In fact, it's ridiculously easy.
 |  |  |
 |  |
 |  |
Yep. That's what I call thinking outside the box. :) And it allows me to do this:
 |  |  |
Footnotes for the advanced class:
1. 79,744 total data points. Which needed to be rotated 55 degrees counterclockwise.
2. Cartesian coordinates are X, Y, Z. Polar coordinates are directions with magnitudes (or angles with radii) (or, in 3D, it's azimuth and elevation to go with the radii). Rotating in polar is easy because all you do is add to the angle. So I converted from cartesian to polar, did some addition, and then converted from polar back to cartesian. Voila!

10 comments:
So, can we leave a ton of comments on Nathan's site explaining cartesian-to-polar conversions? :p
If you must. :D
I've just taken it as a challenge to see if I can explain math in a way that a math-phobe can understand it. ;)
Is that first graph supposed to look like it's on fire?
Haha! :)
Hmmm, I bet the UCF would be a great crowd to give seminars to, with questions like that....
Hmmm, looks a lot like bathythermal sonobouy samples across the isothermalcline.
Sorry used to hunt submarines, and that looks a lot like some of the displays we used.
Man, I love cool graphics
Nathan isn't here, so i'll say it for him.....This makes my head hurt!
Curses. Foiled again. T.T
My weekday blogging has been extremely limited recently, so I just found this today while catching up.
I never took any advanced geometry because it was..youknow, math. But I enjoyed basic geometry a lot. It's visual, so it makes total sense to me...at least as far as I went with it.
What you're doing here is actually something I think I could understand with a little (a lot?) more foundation. It's the other stuff you regularly play with that makes my head get all wobbly.
Oooooo.... math and graphics. Have you ever played with MATLAB?
Why yes, yes I have. :)
I mutter about how much 7.3 sucks all the time. Also, all of the figures in this post were made with Matlab.
Post a Comment